khennessy
Forum Replies Created
-

Hi,
Hopefully I can help answer your question below here:
1. Overview of Streaming
This is a very useful video about how Streaming queries are set up : KX Dashboards | Streaming Data – YouTube
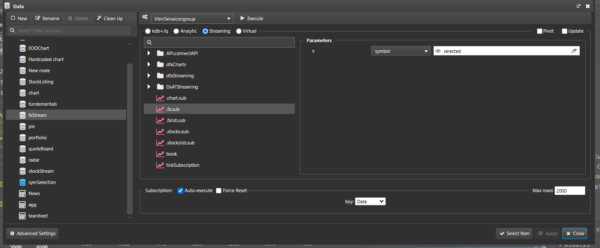
2. Demo Streaming with Filtering
If you have KX Dashboards installed (https://code.kx.com/dashboards/gettingstarted/)
Then navigate to the “Demo Stream” Dashboard, there is a build in example where we pass in a parameter to the streaming model that filters the returning data set .
Therefore:
1. On load – we subscribe to the using the default filter
2. If we change the viewstate, we then unsubscribe and the re-subscribe using the new filter
-
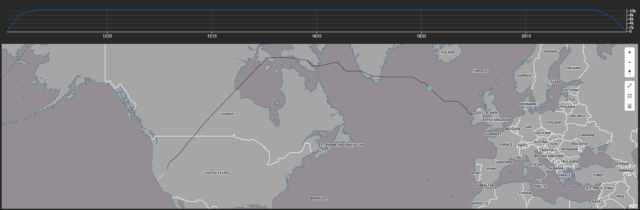
In the current map solution we are just tracking the altitude value at present
There are couple things here that you could do to demonstrate altitude
1) You could use a data-driven line gradient – this would color the line based on the current altitude
2)You could use a secondary chart to show the altitude
If you need anymore details here just let me know
Regard
Kieran