KX Community

Find answers, ask questions, and connect with our KX Community around the world.
KX Community Guidelines

Home Forums KX Solutions KX dashboards: time axis

  • KX dashboards: time axis

    Posted by aina-uvarova on October 16, 2024 at 11:23 am

    Hi,

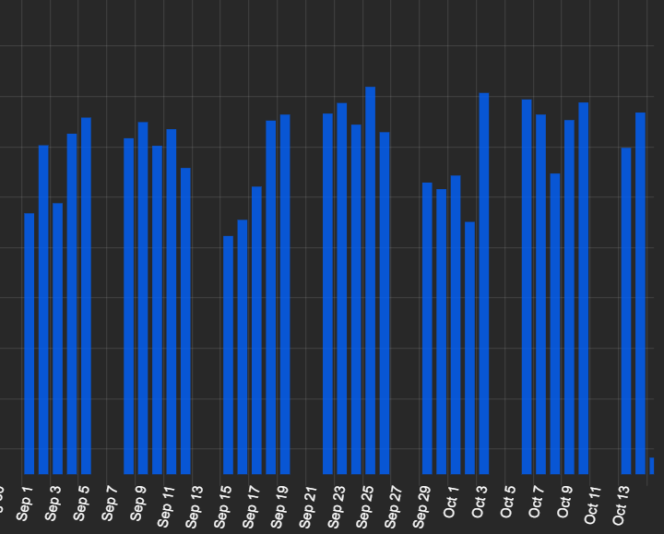
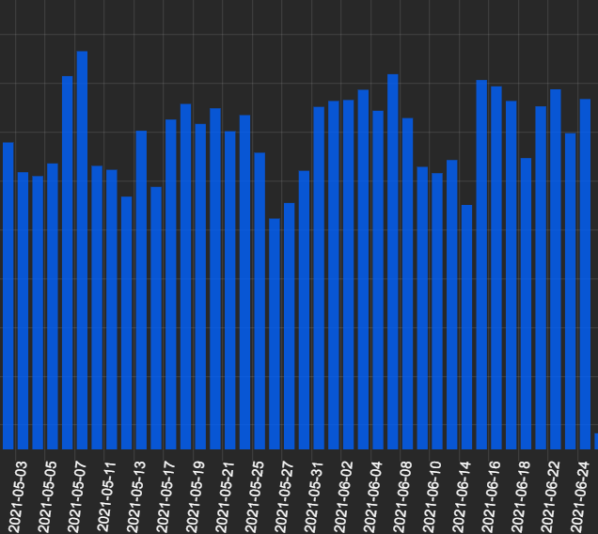
    I have a canvas chat (bar chart) that plots data over time. When I chooses x-axis to be time, the graph starts to have multiple gaps for weekends and dates not in my range. How can I fix it so it only plots dates in my range without having to choose x-axis to be category?


    aina-uvarova replied 7 minutes ago 2 Members · 2 Replies
  • 2 Replies
  • megan_mcp

    Administrator
    October 17, 2024 at 10:58 am

    Hi @aina-uvarova

    Changing Time Formats “Distribution” to smart or series should fix this!

    • This reply was modified 5 hours, 16 minutes ago by  megan_mcp.
  • aina-uvarova

    Member
    October 17, 2024 at 4:07 pm

    Thank you, this worked!

Log in to reply.