-
How to use scan to obtain cumulative value of a function
Hello everyone, I am working on the backtest of a trading strategy with volume-based signals. The strategy is quite complex and starts with tick-by-tick data analysis, looking for certain volume reversal patterns. Specifically, I am filtering significant levels where, if a reversal signal occurs, I take it into consideration. The levels are taken from a daily volume profile, and all levels above a certain volume (3000 volumes in the case of 6E) are considered significant levels. I am summarizing and sharing a sample dataset with the levels, where for each day (column “values”) there is a list of all significant levels for that specific day.
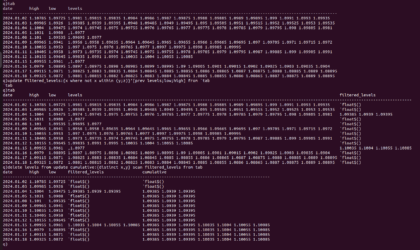
EXAMPLE DATASET ON 6E FUT
<pre class=”hljs language-q”>tab: ([] date: (2024.01.02; 2024.01.03; 2024.01.04; 2024.01.05; 2024.01.08; 2024.01.09; 2024.01.10; 2024.01.11; 2024.01.12; 2024.01.15; 2024.01.16; 2024.01.17; 2024.01.18);
high: (1.10785; 1.09985; 1.1004; 1.1031; 1.101; 1.09965; 1.10035; 1.10405; 1.10155; 1.09955; 1.0979; 1.09115; 1.09325);
low: (1.09725; 1.0926; 1.09475; 1.0908; 1.09535; 1.0941; 1.0953; 1.0958; 1.09645; 1.0961; 1.08895; 1.0871; 1.0872);
levels: (1.0981 1.09815 1.09835 1.0984 1.0986 1.0987 1.09875 1.0988 1.09885 1.0989 1.09895 1.099 1.0991 1.0993 1.09935;
1.09385 1.0939 1.09395 1.0948 1.09485 1.0949 1.09495 1.095 1.09505 1.0951 1.09515 1.0952 1.09525 1.0953 1.09535;
1.0974 1.09745 1.0975 1.09755 1.0976 1.09765 1.0977 1.09775 1.0978 1.09785 1.0979 1.09795 1.098 1.09805 1.0981;
enlist 1.0977;
1.09695 1.0977;
1.0956 1.0958 1.09635 1.0964 1.09645 1.0965 1.09655 1.0966 1.09665 1.09695 1.097 1.09705 1.0971 1.09715 1.0972;
1.097 1.0975 1.0976 1.09765 1.0977 1.0997 1.09975 1.0998 1.09985 1.09995;
1.0973 1.09735 1.0974 1.09745 1.0975 1.09755 1.0978 1.09785 1.0979 1.09795 1.0987 1.09885 1.099 1.09905 1.0991;
1.09835 1.0991 1.0995 1.10035 1.1004 1.10055 1.10085;
enlist 1.0977;
1.0897 1.08975 1.0898 1.08985 1.0899 1.08995 1.09 1.09005 1.0901 1.09015 1.0902 1.09025 1.0903 1.09035 1.0904;
1.08825 1.0883 1.08835 1.0884 1.08845 1.0885 1.08855 1.0886 1.08865 1.0887 1.08875 1.0888 1.08885 1.0889 1.08895;
1.0881 1.08815 1.0882 1.08825 1.0883 1.0884 1.08845 1.0885 1.08855 1.0886 1.08865 1.0887 1.08875 1.0889 1.08895));Starting from this point, I would like to calculate in a new column a cumulative list that carries forward significant values over time, so they remain available even, for example, months after being generated, as long as the price hasn’t touched them.
I created a function that checks whether, day by day, the daily high and low have touched the levels in the list. If the levels are not touched (i.e., outside the high and low range), they should remain.
<pre class=”hljs language-css”>filterLevels:{[row]
// Define the conditions
wHigh:{[x;y] x > y};
wLow:{[x;y] x < y};
// Get the levels, high, and low from the row
high: row`high;
low: row`low;
prev_levels: row`prev_levels;
// Determine matches
matchesHigh: wHigh[prev_levels; high];
matchesLow: wLow[prev_levels; low];
// Filter the elements that match the conditions
list_matched_high: prev_levels where matchesHigh;
list_matched_low: prev_levels where matchesLow;
// Combine the lists and remove duplicates
final_list: distinct list_matched_low, list_matched_high;
// Return the sorted final list
:asc final_list;
}<pre class=”hljs language-q”>
tab: update prev_levels: prev levels from tab;[
tab: update filtered_levels: filterLevelsByPercent each tab from tab;I can calculate this day by day, applying the function I mentioned. What I would like to achieve is a column with cumulative values day after day, following the described logic. I have tried various approaches, and the correct one should be using “SCAN”
(,)function[dataset]
How do I apply the function using this logic? So, to check the high and low and generate a column with cumulative values?
Log in to reply.


